GENI DEMO
This is a work in progress with a demo implementation to illustrate ideas and expectations on a tracing tool for SDN deployments.
Note
All experiment control of the GENI demonstration
is achieved using the geni-lib tool at its official documentation here. Installation of
geni-lib is required to set up and control the experiments: please use
installation instructions at the geni-lib documentation site.
Multi-path Topology
The topology below has been created using the VTS (virtual topology services) on GENI:
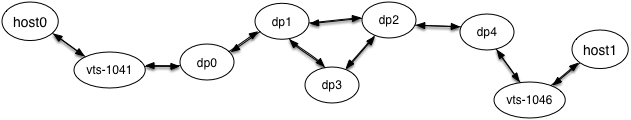
There are six datapath elements. The internal circuits connect:
dp0 to dp1
dp1 to dp2
dp1 to dp3
dp3 to dp2
dp2 to dp4
And, there are only two PG circuits to attach VM end points on the topology:
dp0 with originator
dp4 with destination
The paths for the two application flows are to be setup with flow rules on switches as:
TCP flow on: dp0, dp1, dp2, dp4, destination
UDP flow on: dp0, dp1, dp3, dp2, dp4, destination
The GENI reservations are accomplished using the geni-lib scripts posted in the repo’s
gec23demo directory. OFLoopTopology.py reserves the topology described here.
Controller Setup
At the controller node, install RYU controller and follow instructions from the README file of this repo to set repo and NB app up with its dependencies.
Start SDNTrace application:
ryu-manager ryu-app/ryu-trace-app.py
Originator Setup
At the orginator node, install the packages listed in README and run to send a probe packet:
cd sdntrace/
python trace-client/trace-client-with-GUI.py
Experiment Workflow
Before starting the controller, modify topology using the portDown feature of VTSAM:
VTSAM.UtahDDC.portDown(context, "sdntraceDemo", "dp3:0")
Start the controller, and verify that the datapaths are all connected at this time with this directed acyclic graph.
Note
You can verify connectivity of datapaths using the sliverstatus feature
of VTSAM by calling the VTSAM.UtahDDC.sliverstatus(context, "sdntraceDemo").
The sliverstatus printed text will tell us whether our datapath elements are connected to the controller and what their DPIDs are:
{'geni_resources': [{'geni_error': '',
  'geni_status': 'ready',
  'geni_urn': 'urn:publicid:IDN+ch.geni.net:VTS-experiments+slice+sdntraceDemo:631cb687-1101-41ca-9473-265638a76d9b'}],
  'geni_status': 'ready',
  'geni_urn': 'urn:publicid:IDN+ch.geni.net:VTS-experiments+slice+sdntraceDemo:631cb687-1101-41ca-9473-265638a76d9b',
  'vts_datapaths':
  [{'client-id': 'dp0',
    'connected': False,
    'dpid': 'a2:88:be:9d:0c:b5:fd:f1',
    'ports': [{'client-id': 'dp0:1', 'name': 'vlan3693'},
    {'client-id': 'dp0:0',
    'name': '7137318802624'}]},
   {'client-id': 'dp1',
    'connected': False,
    'dpid': 'a0:51:5f:83:f9:a7:6e:fc',
    'ports': [{'client-id': 'dp1:2',
    'name': '1471796398048'},
    {'client-id': 'dp1:0',
    'name': '4383286160025'},
    {'client-id': 'dp1:1',
    'name': '1661875448123'}]},
   {'client-id': 'dp2',
    'connected': False,
    'dpid': 'a6:b9:8e:4c:e6:a8:51:07',
    'ports': [{'client-id': 'dp2:1',
    'name': '3872144899212'},
    {'client-id': 'dp2:0',
    'name': '1288915914021'},
    {'client-id': 'dp2:2',
    'name': '893223727791'}]},
   {'client-id': 'dp3',
    'connected': False,
    'dpid': 'a6:fc:67:0c:43:d3:a4:a9',
    'ports': [{'client-id': 'dp3:0', 'name': '53343421289'},
    {'client-id': 'dp3:1',
    'name': '946368135596'}]},
   {'client-id': 'dp4',
    'connected': False,
    'dpid': 'ba:32:63:0e:e6:4c:3a:51',
    'ports': [{'client-id': 'dp4:1', 'name': 'vlan3692'},
    {'client-id': 'dp4:0',
    'name': '1261830267274'}]}]
 }
Once all nodes are connected the controller will also display the DPIDs read on the network, on controller terminal where the NB application is running:
ubuntu@ip-172-31-22-225:~/traceprotocol$ sudo ryu-manager --ofp-tcp-listen-port=7733 ryu-t
loading app ryu-trace-app.py
loading app ryu.topology.switches
loading app ryu.controller.ofp_handler
instantiating app ryu-trace-app.py of SimpleSwitch
instantiating app ryu.topology.switches of Switches
instantiating app ryu.controller.ofp_handler of OFPHandler
{}
[12032605606802334889L]
{}
[12032605606802334889L, 11552119539615887100L]
{}
[12032605606802334889L, 11711820412709371377L, 11552119539615887100L, 12013789941925957895
{}
[12032605606802334889L, 11711820412709371377L, 11552119539615887100L, 13416895155534576209
{}
[12032605606802334889L, 11711820412709371377L, 11552119539615887100L, 13416895155534576209
From the originator node, issue a
pingto the destination host to start the learning process for the controller:... {} [12032605606802334889L, 11711820412709371377L, 11552119539615887100L, 13416895155534576209 Learned MAC 02:36:de:dc:de:9e at DPID 11711820412709371377 Learned MAC 02:aa:c7:52:80:b8 at DPID 13416895155534576209Before we run the trace, the topology needs to know the paths for each flow for this network. Create (or modify the existing
flowRules.py) a flow definition file inside thegec23demodirectory.The
flow.infois used to write these flows into the datapaths in VTS topology using the addFlows feature:d = json.loads(open("/Users/dgurkan/sdntrace/gec23demo/flow.info").read()) VTSAM.UtahDDC.addFlows(context, "sdntraceDemo", d)
Bring the port that was down, back up again using:
VTSAM.UtahDDC.portUp(context, "sdntraceDemo", "dp3:0")
Once the flows are written into the datapath elements in the topology, we expect paths for particular flows (in this example, there is a separate path for tcp flows and another path for udp). The flows can be checked on the datapaths using the dumpFlows feature of VTS:
VTSAM.UtahDDC.dumpflows(context, "sdntraceDemo", ["dp0", "dp1", "dp2", "dp3", "dp4"])
Now, the topology has two paths setup for two different flows (differentiated by the network protocol type, 17 for udp, and 6 for tcp). Flows are written into the devices on the paths between the originator node and the destination. The controller has learned the forwarding of end hosts. We can run the client (or, originator) SDNTrace to insert a probe into the network to trace the path of either one of these flows. Using the GUI gives us only end destination MAC address match option:
sudo python trace-client-with-GUI.py eth1
The command line version of
trace-client.pyhas the option to specify the type of network protocol to be traced:sudo python trace-client.py eth1 02:aa:c7:52:80:b8 tcp
The client then should issue a probe for the packet to be traced. The controller will display all trace requests and replies received during the course of the trace:
ubuntu@ip-172-31-22-225:~/traceprotocol$ sudo ryu-manager --ofp-tcp-listen-port=7733 ryu-trace-app.py
loading app ryu-trace-app.py
loading app ryu.topology.switches
loading app ryu.controller.ofp_handler
instantiating app ryu-trace-app.py of SimpleSwitch
instantiating app ryu.topology.switches of Switches
instantiating app ryu.controller.ofp_handler of OFPHandler
{}
[12032605606802334889L]
{}
[12032605606802334889L, 11552119539615887100L]
{}
[12032605606802334889L, 11711820412709371377L, 11552119539615887100L, 12013789941925957895L]
{}
[12032605606802334889L, 11711820412709371377L, 11552119539615887100L, 13416895155534576209L, 12013789941925957895L]
{}
[12032605606802334889L, 11711820412709371377L, 11552119539615887100L, 13416895155534576209L, 12013789941925957895L]
Learned MAC 02:36:de:dc:de:9e at DPID 11711820412709371377
Learned MAC 02:aa:c7:52:80:b8 at DPID 13416895155534576209
port modified 1
port modified 3
Trace Request: 11711820412709371377
Trace Request: 11552119539615887100
Trace Request: 12013789941925957895
Trace Reply: 12013789941925957895
Trace Reply: 11552119539615887100
Trace Reply: 11711820412709371377
The result from the trace client should display the hop IDs on the path:
dgurka01@host0:~/sdntraceprotocol$ sudo python trace-client.py eth1 02:aa:c7:52:80:b8 tcp
WARNING: No route found for IPv6 destination :: (no default route?)
.
Sent 1 packets.
0180c20000000236dedcde9e882000020014620000000502002502aac75280b80236dedcde9e0800450000280001000040067ccd7f0000017f00000101010da288be9d0cb5fdf1010201010da0515f83f9a76efc010201010da6b98e4ce6a85107010301010dba32630ee64c3a510201
ethernet(dst='01:80:c2:00:00:00',ethertype=34848,src='02:36:de:dc:de:9e'), TraceReply(checksum=0,length=98,objects=[FlowSpecObject(header=ObjectHeader(length=37,sub_type_=0,type_=2),packet=ethernet(dst='02:aa:c7:52:80:b8',ethertype=2048,src='02:36:de:dc:de:9e'), ipv4(csum=31949,dst='127.0.0.1',flags=0,header_length=5,identification=1,offset=0,option=None,proto=6,src='127.0.0.1',tos=0,total_length=40,ttl=64,version=4)), HopObjectDPID(dpid=11711820412709371377L,egress_interface=2,header=ObjectHeader(length=13,sub_type_=1,type_=1),ingress_interface=1), HopObjectDPID(dpid=11552119539615887100L,egress_interface=2,header=ObjectHeader(length=13,sub_type_=1,type_=1),ingress_interface=1), HopObjectDPID(dpid=12013789941925957895L,egress_interface=3,header=ObjectHeader(length=13,sub_type_=1,type_=1),ingress_interface=1), HopObjectDPID(dpid=13416895155534576209L,egress_interface=1,header=ObjectHeader(length=13,sub_type_=1,type_=1),ingress_interface=2)],ttl=20,type_=2,version=0)
HopObjectDPID(dpid=11711820412709371377L,egress_interface=2,header=ObjectHeader(length=13,sub_type_=1,type_=1),ingress_interface=1)
HopObjectDPID(dpid=11552119539615887100L,egress_interface=2,header=ObjectHeader(length=13,sub_type_=1,type_=1),ingress_interface=1)
HopObjectDPID(dpid=12013789941925957895L,egress_interface=3,header=ObjectHeader(length=13,sub_type_=1,type_=1),ingress_interface=1)
HopObjectDPID(dpid=13416895155534576209L,egress_interface=1,header=ObjectHeader(length=13,sub_type_=1,type_=1),ingress_interface=2)